Views report
The Views report contains data about views and estimated minutes watched for the content, geography and date range specified in the data filter. Analytics views data is updated once a day, which means that the numbers displayed in these reports may differ from the public values displayed on the video page, channel page, Video Manager, or other sources.
The aggregate data includes views and estimated minutes watched from YouTube.com, the embedded player, and mobile YouTube applications. No personally identifiable information is collected or shared.
To access the Views report, click the Views section on the left hand menu in YouTube Analytics.
You’ll also find this report on mobile in the YouTube Creator Studio App. Just tap the navigation guide in the upper left corner to open and then select Analytics.

Views
The views section shows the number of views for your top 200 channels or videos. Note that just active views will be counted and that it won’t include views from videos set to autoplay.
This data is available from January 1st, 2013. For earlier time frames you’ll still see data for the top 10 items.
If your public video viewcount is frozen at 301+, and the value is different than the count displayed in YouTube Analytics, this may be the result of our viewcount validation process. Check this article to find more information about why viewcount freezes.
You can also compare the number of views to the number of individual people that viewed this content through the Unique Cookies metric. This metric counts the number of browser cookies for a given video or channel. Note that, if a viewer clears their cookies, uses more than one device, or uses more than one browser to watch your video or channel, they will be counted more than once.
Estimated minutes watched
This shows the estimated amount of time that a viewer has watched a video. This way you have a better sense of what content viewers actually watch, over those that they click on and then abandon. Learn more about why YouTube uses watch time as a metric.
Demographics report
The Demographics report helps you understand the age range and gender distribution of your audience and is based on logged-in users on all devices. You can adjust the date range and geographic region to see how the breakdown of your audience varies. You can view this data in both interactive graphs and the chart at the bottom with numerical data.
You can access the Demographics report by clicking the Demographics section on the left hand menu in YouTube Analytics.

Gender distribution
The gender distribution metric shows the proportion of males vs. females among your viewers. Click the Male or Female btns to see more details on the age of the viewers of that gender in the graph. The table below will show information on the viewers’ age by country.
Age distribution
This graph shows the distribution of your viewers by age and gender. The blue bar graph displays the percent of total views that were by males of the given age group, while the orange graph displays the percent of total views that were by females of the given age group.
If you would like to isolate the data in the graph to a particular gender, click the large Male or Female btns at the top of the page.
Pie chart
The pie chart displays the distribution of your audience, with Males represented by blue, and Females represented by orange.
Top locations by views
This table shows the locations where your video or channel received more views. You can get more details on the age distribution of your viewers in a specific location or see which were the top locations for viewers of a specific gender. Note that not all views might be represented in this table, as only the locations with a large enough sample size will be shown. This may also cause the table to differ from the graph above.
Subscriber demographics
You can select “Show only subscriber views to see the demographics of the subscribers who are viewing your content.
Find out more about what to look for in your Demographics report data and strategies to consider.
Playback locations report
The Playback Locations report shows the page, site, or device that the video was viewed on.
Access the Playback Locations report by clicking on the Playback locations section on the left hand menu in YouTube Analytics.
Here are some details about the different types of Playback locations that you might see in the report.
- YouTube watch page: This means that the video was watched on YouTube from the video’s specific page. It is the precise address for the video where you can watch the video on YouTube (e.g. http://www.youtube.com/watch?v=Wq1efyUd29k)
- The YouTube Channel Page: Views directly on a channel page (e.g. http://www.youtube.com/associatedpress)
- YouTube other: Certain browsers and players do not allow us to detect in detail where on YouTube the content was viewed. It’s likely that the majority of these views happened on the YouTube watch page.
- Embedded players on other websites: This shows how many people viewed your video when it was embedded on another website, like a blog. Click on the link to drill down to a breakdown of views across the various sites that have embedded your video.
- External apps: Views from various Android apps that embed the YouTube player.
- Mobile devices: Views on mobile applications (e.g. iPhone, Android) and YouTube’s mobile site (m.youtube.com). This category will only show data until September 9th 2013.
Find out more about what to look for in your Playback Location report data.

Traffic Sources Report
Your Traffic Sources Report shows the sites and YouTube features that viewers use to find your content. You can use it to get insight into the many ways viewers find videos — for example, see if viewers are searching directly on YouTube, clicking “Suggested Videos” thumbnails, or following links from social networking websites like Twitter or Facebook.
View & use your Traffic Sources Report
- Go to YouTube Analytics.
- In the left-hand menu, click Traffic Sources.

- Open the YouTube Creator Studio app. If you don’t have it, you can follow the instructions to download and install it.
- In the upper left corner, touch the navigation guide
 .
. - Touch Analytics.
- From the reports that appear, touch the Traffic Sources report.
 .
.You can change the number of days you want the report to show (for example, the last 7 days or the last 3 months).
Use these tips on desktop to get the most out of your report:
- Set date range: You can change the number of days you want the report to show using the drop-down menu or calendar in the top-right of the report (for example, the last 7 days or the last 3 months).
- Deep dive on videos: Use the “Search for content” box at the top of the report to choose videos from your channel.
- View sources by location: Use the “Search for locations” box at the top of the report to view sources by location. Click for suggested regions and countries.
- Deep dive on sources: For some videos, you can click traffic sources listed in the report to get detailed data. For example, if you click the YouTube Search traffic source, you’ll be able to see the search terms viewers use to find your video.
- Filter sources: Check or uncheck the boxes next to sources (like “Google Search” or “Playlists”) to include or remove them from your report. This lets you to compare only the traffic sources you care about or take a look at a single source more closely.
- Filter viewers: Change whether the report shows all view or only those from subsribers or non-subscribers to your channel by using the “Subscribed & not subscribed” drop-down menu at the top of the report.
Understand your traffic sources
There are two main groups of traffic sources: views from sources within YouTube and views from external sources. You can see both in the Traffic Sources Report.
Views from sources within YouTube
These are views on desktop, YouTube mobile apps, and other features within YouTube. Here are the top traffic sources within YouTube (click to expand a description):
Traffic from search results on YouTube. You can also see the search terms used by viewers if provided by the users’s browser/player.
Traffic from suggestions that appear next to or after other videos and from links in video descriptions.
Traffic from the homepage/home screen, subscription feed, and other browsing features for both signed-in and signed-out users.
Traffic from any playlist that included one of your video (this can be your own playlist or another user’s playlist). This traffic also includes users’ “Liked videos” and “Favorite videos” playlists.
Traffic from other creator and topic channels. Topic channels are automatically created based on YouTube’s video discovery system (like the YouTube Music channel).
This traffic source shows ad playbacks that qualify as a view, based on these criteria:
- Skippable ads that are longer than 12 seconds and watched for a certain time period.
- Non-skippable ads that are autoplaying never qualify as view in YouTube Analytics.
- Other ads need to be clicked to play by the viewer in order to qualify as a view.
Traffic coming from an annotation, card, or featured content in another video.
Traffic from automatic phone or tablet notifications and emails sent to your subscribers.
Traffic from within YouTube that doesn’t fall in any other category, such as views from Partner promotions, the Android homescreen widget, or a dashboard.
Views from sources outside of YouTube
These are views resulting from links outside of YouTube, such as Google search, Facebook, and other websites. Here are the top traffic sources for sources outside of YouTube (click to expand a description):
Traffic from websites and apps that have your YouTube video embedded or linked to. You can see what websites and apps are embedding your video in your Playback Locations Report.
Traffic from direct URL entry, bookmarks, and unidentified apps.
Changes to the traffic source classification
June 2015 updates
- External sources: All external traffic sources are now merged in the “External” category. This includes the former top-level sources External apps, Unknown – embedded player, and External website. External apps and embedding URLs are shown by name.
- Notifications: New top-level source that includes both desktop and phone/tablet notifications for subscribers.
- YouTube guide: Renamed to “Browse features.” Now includes traffic from the YouTube Kids app. “Liked videos” and “Favorite videos” are included in Playlists. Subscription update email is now included in the new top-level source Notifications.
- Unknown – direct: Renamed to “Direct or unknown.”
- YouTube – other features: Renamed to “Other YouTube features.” Notification is now included in the top-level source “Notifications.”
- YouTube playlists: Renamed to “Playlists.” Now includes “Liked videos” and “Favorite videos.”
- YouTube video card and annotations: Renamed to “Video cards and annotations.”
- External apps: Now included in the “External” category.
- Unknown – embedded player: Now included in the “External” category.
- YouTube Guide > Recommended channels: Now included in “Other YouTube features.”
- YouTube Guide > Liked videos: Now included in “Playlists.”
- YouTube Guide > Favorite videos: Now included in “Playlists.”
- YouTube Guide > Subscription update email: Now included in “Notifications.”
- YouTube Guide > Recommended channels: Now included in “Other YouTube features.”
- YouTube – other feature > Notifications: Now included in “Notifications.”
March 2014 updates
- Google Search: Included in “External” category. This category no longer provides search terms due to privacy reasons.
- YouTube Guide > Homepage: This sub-category is now included in YouTube Guide > What to watch, which shows views from both the signed-in and signed-out homepage.
- YouTube – Other features > Subscription feed: This sub-category is now included in YouTube guide > My subscriptions.
- Unknown – direct: Mobile views can be categorized better and are included in the respective top-level category. Therefore this category is showing less views.
- Unknown subcategories: Views are classified as “unknown” if we don’t receive all details from certain browsers or players. An example is YouTube suggested video > Unknown. This means we can classify the top-level traffic source as suggested video traffic, but we cannot attribute the view to a specific video.As the classification improves, views in the respective unknown categories are decreasing and views for specific videos are increasing.
Audience retention report
The Audience retention report is an overall measure of your video’s ability to retain its audience.
On the main “Audience retention” page, you’ll see the average view duration for all videos on your channel, as well as a table with the top 200 videos or channels on estimated minutes watched.
To see audience retention data for a specific video, click the name of the video in the table. From there, you can play your video to see how different parts of your video are doing.
You’ll also find this report on mobile in the YouTube Creator Studio App. Just tap the navigation guide in the upper left corner, select Videos, tap on a video and you’ll see a section with audience retention. You can tap on audience retention to adjust your view for a particular time period.
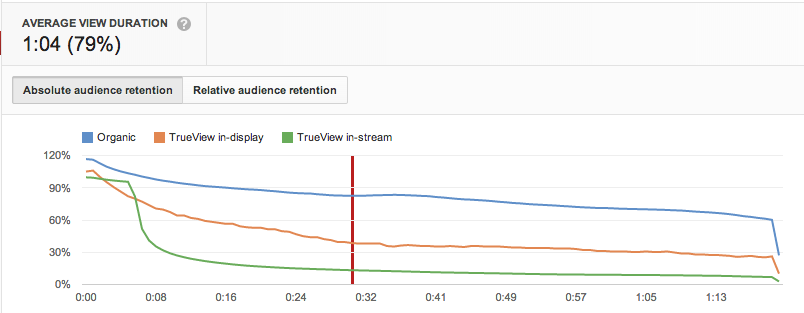
Types of audience retention
- Absolute audience retention shows the views of every moment of the video as a percentage of the number of video views. Pay close attention to the first 15 seconds of every video–that’s when viewers are most likely to drop-off.
- Relative audience retention shows your video’s ability to retain viewers during playback in comparison to all YouTube videos of similar length. The higher the graph at any given moment, the proportionately more viewers kept watching your video over the preceding seconds of playback versus other videos at that same moment in their playbacks.

Audience retention by traffic type
There are three different curves available for the Audience retention report, whether these are displayed depends on the type of traffic a video receives.
- Organic traffic: Views that are the direct result of user action, for example somebody searched for a video or clicked on a suggested videos or browsed a channel etc.
- Paid traffic:
- TrueView in-stream: Ads that are auto-played before a video and the user has the option to skip the ad after five seconds. This graph includes both ad views (when an ad is viewed until completion or more than 30 seconds) and ad playbacks (when an ad is skipped after five or more seconds). This data helps advertisers to determine viewers’ drop-off points during the entire playback.
- TrueView in-display: Ads that the user selects to play (includes TrueView in-display and TrueView in-search).
*Want to know how effectively you are hooking and retaining your audience? Learn more about the Audience Retention report.
Devices report
The Devices Report gives you information on the different devices and operating systems that people use to watch your videos.
Access the Devices report by clicking on the Devices section on the left hand menu in YouTube Analytics.
 By clicking the Device type tab, you will be able to see the number of views and estimated minutes watch coming from computer, mobile, TV, game console and other devices both on a channel and video level. If you click on each device type you will see more detailed information on the different operating systems the viewers are using in those devices.
By clicking the Operating Systems tab, you will get more details on the software system of the device on which the view occurred. You can select each Operating System to find out more details of which devices are being used in each case.
These are the most common devices and operating systems:
- Computer: Windows, Macintosh, Linux.
- Mobile: Android, iOS, Blackberry, Windows Mobile, Symbian, Bada, Linux, etc.
- Tablet: Android, iOS, Blackberry
- Game Console: Wii, Playstation, Xbox, Windows Mobile