Subscribers report
The Subscribers report shows how you’ve gained and lost subscribers across different content, locations and dates. Subscribers are vieweres who tend to be more engaged with your content and watch your videos on a regular basis. This section helps you understand your effectiveness at building a base of subscribers, spot videos which drove subscriptions and unsubscriptions, and identify locations where your content is particularly popular.
You can access the Subscribers report by clicking the Subscribers section on the left hand menu in YouTube Analytics.
Above the Line chart/Map, you can click to see Subscribers, Subscribers gained, and Subscribers lost.

*By understanding where your subscribers are coming from, you’re better able to optimize how and where you can promote future videos so they attract new fans.
Likes and Dislikes report
The Likes and Dislikes report summarizes how many people liked and disliked your videos.
The report shows the net change of likes and dislikes in your videos, so it adds up the number of likes/dislikes added, minus the number of likes/dislikes removed.

Use the Compare metric btn to compare the total number of likes/dislikes to other video metrics, including engagement metrics such as likes/dislikes added and removed, or subscribers and favorites change.
The table at the bottom of the page shows “Total engagement”, which aims to help you understand which videos are attracting and engaging the audience the most. “Total engagement” includes the following data:
- likes, dislikes
- favorites added and removed
- shares
- comments
- subscribes and unsubscribes
Click any of the video titles in the chart to view the specific report for that video.
Notes:
- For some periods of time the likes/dislikes net change might be negative if the number of likes removed is bigger than the number of likes added.
- The report only shows data for likes/dislikes removed since September 1, 2012.
Favorites report
The Favorites report show how many people marked your content as a favorite and how many removed it from their favorites. You can see the cumulative number of favorites over a selected date range and location.
Above the Line chart/Map, click to see Favorites net change, Favorites added, and Favorites removed.
The table at the bottom of the page shows “Total engagement”, which aims to help you understand which videos are attracting and engaging the audience the most. “Total engagement” includes the following data:
- likes, dislikes
- favorites added and removed
- shares
- comments
- subscribes and unsubscribes
Click any of the video titles in the chart to view the specific report for that video.

Videos in playlists report
The Videos in playlists report shows how many times your videos were added or removed to viewers’ playlists. This can be default playlists such as “Watch later” or “Favorites” as well as any other playlist a user or yourself have created.
Access the Videos in playlists report by clicking Videos in playlists in the navigation menu in YouTube Analytics. You can see the overall number of times your videos were included in a playlist over a selected date range and location, as well as break out Videos added to playlists and Videos removed from playlists.
Click any of the video titles in the table to view the specific report for that video.

Comments report
The Comments report summarizes how many people are commenting on your video.
Access the Comments report by clicking the Sharing section on the left hand menu in YouTube Analytics.
The table at the bottom of the page shows “Total engagement”, which aims to help you understand which videos are attracting and engaging the audience the most. “Total engagement” includes the following data:
- likes, dislikes
- favorites added and removed
- shares
- comments
- subscribes and unsubscribes
Click any of the video titles in the chart to view the specific report for that video.

Sharing report
The Sharing report shows how many times your content has been shared through the Share btn on YouTube, and what sites viewers are using to share your videos (e.g. Facebook, tumblr, and Blogger). Click the Sharing service btn underneath the Line chart/Map to view detailed information about those sites.
Access the Sharing report by clicking the Sharing section on the left hand menu in YouTube Analytics.

Annotations report
The Annotations report provides information on the performance of video annotations and gives engagement information such as click-through rate and close rate for annotations on videos.
- Impressions: Number of times an annotations was displayed.
- Clickable impressions: Number of times an annotation with the option to click further was displayed.
- Closeable impressions:Number of times an annotation with the option to close it was displayed.
- Click-through rate: The percentage of clickable annotations that received clicks
- Close rate: The percentage of annotation impressions that were closed by the viewer.
- Clicks: Number of clicks on annotations.
You can access the Annotations report by clicking the Annotations tab on the left hand menu in YouTube Analytics.
Note: The engagement data for this report starts only from June 10, 2012. Impression and clicks data is only available from 17 July 2013. If you select a previous time period, the graphs are cut off and a respective message is shown.

Cards report
The Cards report gives you information on how viewers are interacting with cards on your videos on desktop, mobile, and tablet. Access the Cards report by clicking the Cards section in the left-hand menu in YouTube Analytics.
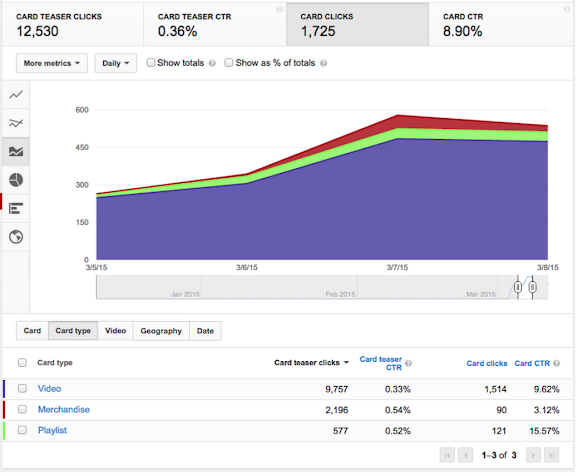
Depending on the type of content you’re looking at, you can select to see cards data by channel, asset, video, card type, individual card, geography, and date.
Available metrics:
- Card teaser impressions: The number of times card teasers are shown. Teasers can have multiple impressions per view.
- Card teaser clicks: The number of clicks on a card teaser. Card icon clicks get attributed to the last teaser shown.
- Card teaser CTR: The click-through-rate of card teasers, which is the ratio of teaser clicks to teaser impressions.
- Card impressions: The number of times a card was shown. A card impression is logged for each card on a video when the card panel is opened
- Card clicks: The number of clicks on a specific card
- Card CTR: The click-through-rate of cards, which is the ratio of cards clicks to card impressions.
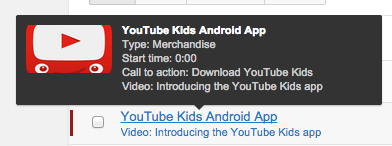
When hovering over individual cards, detailed card information is displayed:
- Card title
- Card type: Available card types are merchandise, fundraising, associated website, video or playlist, as well as Fan Funding for creators in eligible countries.
- Start time: Time in the video the teaser is shown for a few seconds.
- Call to action: The text prompting the viewer to visit the specified link.
- Teaser text: Optional feature for merchandise, fundraising and associated website cards. If not specified, this is the call-to-action text.
- Video that contains the card. Clicking on the video title in the table will bring you to the video’s watch page.
Clicking on the icon next to a card will bring you to the Cards editor in your account directly where you can make any changes to the card.