Learn more about the performance of your videos with YouTube Analytics. You’ll get a ton of data on your channel and videos through different reports (Views, Traffic Sources, Demographics, and more.)
YouTube Analytics basics
YouTube Analytics lets you monitor the performance of your channel and videos with up-to-date metrics and reports. There’s a ton of data available in different reports (e.g. Views, Traffic sources, Demographics).
Access YouTube Analytics directly through youtube.com/analytics. Or sign in to your YouTube account and click on the arrow next to Upload at the top of the page, then Analytics. Then, use the left hand menu to navigate to all the different YouTube Analytics reports.
Viewing data in YouTube Analytics
Here are some basic ways of viewing and understanding all the different types of data you’ll find in the various YouTube Analytics reports.
Filter your data
At the top of many reports you can get the precise information you’re looking for by filtering your reports by Content, Geography, and Date.

Line chart
Line charts show how your video data has changed over time. You can customize the following options:
-
Date granularity: Charts can be displayed with data points in daily, weekly, or monthly increments.
-
Compare metric: Select a second metric for comparison, which will be displayed on the graph. For example, you can plot Viewers next to Unique Cookies.

Multi-line chart
Multi-line graphs allow you to compare the performance of up to 25 videos, channels or geographies over a specific time period at one glance in a number of reports. By default, the top five line items are selected and displayed in differently colored lines, but you can customize your selection to view all the content you’re interested in. In addition, it’s possible to compare the selected items to the total value by selecting “Show totals” in the top right. Note that in this view, it’s not possible to add another metric.

Stacked area
This view shows how data of selected videos, channels or geographies relate to their total and enables you to easily compare performance and determine trends. Similar to Multi-line charts, the top five line items are selected by default and you can customize this selection further by choosing up to 25 items.

Pie chart
Pie charts allow you to visualize up to 25 items in their relative size and you can hover over the sectors to see which item they correspond to. Note that with this chart it’s not possible to see the date dimension or to compare the selected data to the totals as with Multi-line and Stacked area graphs.

Bar chart
With the bar chart you can display the selected data in horizontal bars which represent their values in proportional lengths. This chart type behaves similarly to the Pie chart and defaults back to the Line graph in case the date dimension is selected.

Interactive map
The interactive maps show where your video is being viewed. Darker areas on the map mean that more people are watching your video in that location. You can also hover your mouse over countries on the map to see detailed data for that country.

If you want a quick snapshot of your channel analytics on mobile, review them in the YouTube Creator Studio app:
-
From the dashboard, tap the navigation guide
 in the upper left corner
 -
From the menu, select Analytics
-
Here you’ll find a few top level reports to give you a quick picture of your channel analytics
 in the upper left corner
We don’t have all of the reports currently available on desktop, but you’ll be able to take a look at video views, minutes watched, estimated revenue, and traffic sources.
Download your reports by clicking the Download report btn at the top of the page. The report will include all information that is available for this report. Note that the “Unique cookie” dimension will only be included if the “Date” dimension is selected.
YouTube Analytics settings
You can specify default settings for your YouTube Analytics reports. These settings are applied on the user level and can be overwritten when looking at individual reports. Click on the settings icon on the top right of YouTube Analytics to select a setting for the following fields.

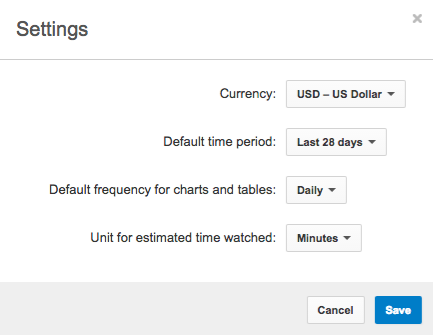
Currency:
You can select your preferred currency to display the earnings in your Estimated Earnings and Ad Performance reports. This currency is only shown in YouTube Analytics and does not affect the currency you’re paid in.
Daily earnings are converted using the prevailing market exchange rate for the day.
Note that even if the reporting currency in YouTube Analytics is the same as your payment currency, the exchange rates used in YouTube Analytics might differ from the exchange rate applied to your final earnings in AdSense.
Currencies other than USD are only available from October 2009.
Default time period:
Specify the time period you’d like to see your reports for when visiting YouTube Analytics. You can pick from the same time intervals which are available to you in the individual reports.
If not specified otherwise, you’ll see data for the last 28 days.
Default frequency for charts and tables:
Select from these intervals:
- Daily
- Daily (rolling 7 day totals)
- Daily (rolling 7 day averages)
- Daily (rolling 28 days totals)
- Daily (rolling 28 day averages)
- Daily (rolling 30 day totals)
- Weekly
- Monthly
- Quarterly
- Yearly
If not specified otherwise, you’ll see daily data in your reports.
Default content (for content owners):
Content owners can specify their preference for one of the available content roll-ups:
- All claimed content:
All videos a partner has applied a usage or match policy to. - Claimed partner and premium user uploaded:
Claimed videos uploaded into a partner’s linked channels as well as claims with very high match quality on user uploads. Mostly applicable to Music Partners. - Claimed standard user uploaded:
Videos uploaded by a third party that a partner’s match policy applies to. - All partner-uploaded:
Claimed and unclaimed videos uploaded by the content owner’s channels. Some metrics like subscribers as well as the “channel dimension” are only available when looking at this content type. - Playlists (if applicable)
All playlists created by the content owner’s channels.
If not specified otherwise, you’ll see data for “All claimed content” in your reports.
Unit for estimated time watched
You can choose between “Minutes” and “Hours” as default time unit.
Use minutes if you’re usually looking at data for smaller content entities like videos, while hours can help you when assessing performance on aggregate data, for example for a content owner or channel. Alternatively, you can also add “Estimated hours watched” as a metric through the “Compare metric” drop-down menu to see both minutes and hours in the table at the same time.
Note that hours are rounded up or down to show full hours.
Overview report
The Overview Report is a high level summary of how your content is doing on YouTube. Here, you can quickly see some basic performance metrics for your content on YouTube.
Here’s some information on the sections you’ll see in the Overview Report. You can click the grey boxes under each section to see additional information:
- Performance metrics: Summarizes the information on views, subscribers and estimated minutes watch for the channel or a single video.
- Engagement metrics: Displays the most relevant data for the different engagement criteria (likes, dislikes, comments, shares and favorites).
- Top 10 videos: Shows the Top10 videos of your channel according to viewcount.
- Demographics: Gathers information on the gender and the localization of viewers.
- Discovery: Summarizes the metrics for top playback locations and top traffic sources to your videos.
Realtime report
When logged in as a content owner or channel, by default the Realtime report shows estimated views data for the last 5 published videos. This data is also available when looking at reports for individual videos. This report can give you early insights into the performance of your most recently published videos and might help you to adjust their promotion strategy going forward. Realtime data is estimated and meant to provide general guidance on potential view activity on your videos.
Data display and accuracy
You can see two graphs for every video:
- Hour-by-hour data is available for a sliding window of 2 days (“Last 48 hours”)
- Minute-by-minute data is available for a sliding window of 1 hour (“Last 60 mins”)
Both graphs are referring to the local time zone of the viewer as determined by the computer’s setting. Data automatically stays updated on the analytics page, but note that there’s a latency of a few minutes between the occurrence of the view and its display in the report. The “current” hour bar is highlighted to stress that the hour is still incomplete.
Data availability
Realtime data is available on a per-video basis and cannot be aggregated. When selecting a different content entity, it is displayed as follows:
Channel: When looking at channel level data, we’re showing the last 5 published videos*. The vertical view count axis is aligned for all videos on one page to make comparisons easier.
Content Owner: Similarly, we show the last 5 published videos of channels belonging to the content owner. In order to see realtime data, content owners must select the “All partner uploaded” option from the drop-down menu.
Groups: If a video group contains 5 or less videos, realtime data for each video is shown. For video groups with more items and other types of groups (asset, playlist, channel) the report is not available.
Assets, playlists, shows: For the moment, we don’t show realtime data for these entities.
Filters and features
The realtime report does not support filtering or further customization of data. Therefore, the geographic filter, the date picker, the comparison and the download functionalities are disabled in the interface.
Playlists in YouTube Analytics
A playlist on YouTube is a collection of videos that you can create with your uploads and other channel’s videos. YouTube Analytics shows you how the public playlists you created are performing.
Access the Playlist reports
You can see data for a specific playlist by selecting it from the content picker or searching for it. Note that you can only see data for playlists which contain more than three videos.
In addition, there are two more ways to see Playlist reports:
Select “Playlists” from the drop-down menu to display playlist metrics. A new “Playlist” dimension will appear above the table in the Views and Audience retention report that allows you to see your top playlists. The other dimensions in the table show different breakdowns of your playlist performance.
Click on the “Playlist” btn below the content search box to display playlist metrics. This selection can be toggled with “Uploads” which will show you the data for all of your videos instead of your playlists. A new “Playlist” dimension will appear above the table in the Views and Audience retention report that allows you to see your top playlists.
Availability of Playlist reports
For playlists, you can see the Overview report and the Views reports. However, data for Earnings or Engagement reports is not available.
Playlist metrics
The following metrics are available to assess the performance of a playlist. You can add these through the “Compare metric” drop-down menu.
- Views: Video views in the context of a playlist.
- Estimated minutes watched: Estimated total minutes of viewing time of your video(s) from your audience.
- Average view duration: Estimated average minutes watched per video view for the selected content, date range and region.
- Playlist starts (web only): The number of times viewers initiated playback of a playlist.
- Average time in playlist (web only): Estimated average time watched after a playlist start.
- Views per playlist start (web only): Average number of video views after a playlist was initiated.
Playlist reports FAQ
In order to see data for playlists, one of your playlists must have been viewed at least once since February 1, 2014.
YouTube Analytics only shows data for playlists which received views in the selected time period and are public. If you want to track the performance of your private or unlisted playlists, please update their privacy settings.
No, this report shows data regardless of the ownership of the videos; this is a reason we can’t provide earnings data. You can see to which channel a video belongs to when hovering over the video title.
The video would still show as part of the playlist in the reports if it was part of the playlist during the selected time period.
In general, the current number of videos belonging to a playlist can differ from the number of videos you see in the list for a given playlist. This is because a playlist can be modified at any time and we’re displaying historic views if a video was part of a playlist during the specified time period. Also, recently uploaded and added videos might not have accrued views data yet so you won’t see them in the list of videos yet.
No, you can still see data for playlists without having uploaded your own videos.
When selecting to “Play all” videos from a channel section, the playlist is shown with the section title.
Yes, you have the option to create groups based on your playlists. Simply select “Create playlist groups” in the Groups drop-down menu.