Aux Mode Dashboard
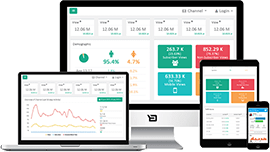
Our dashboard is a graphical user interface which provides at-a-glance views of key performance indicators. Progress reports, data visualization, and information management tools are used to track, analyze, and display key performance indicators, metrics, and data points of your content and revenue.
The difference between a dashboard and a report is the continued monitoring (like daily or weekly) we can provide. What makes dashboards and reports so valuable is how you and your team use them to your advantage.
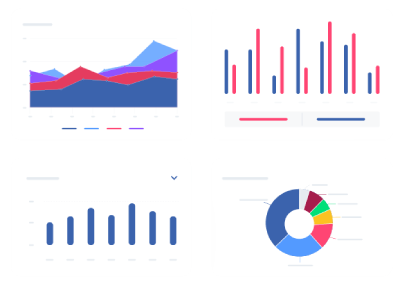
Our dashboard transforms the raw data into something human-readable. Instead of sifting through columns or rows in a spreadsheet, you can analyze your data in a table, line chart, bubble chart, or bar chart, just to name a few options.
We can help simplify your video streaming data.
Learn More